Backup Metrics
A chart of backup metrics over time is shown on both the dashboard (table view) and the server details page.
- Dashboard, the chart shows the total number of backups recorded in the duplistatus database. If you use the Cards layout, you can select a server to see its consolidated metrics (when side panel is showing metrics).
- Server Details page, the chart shows metrics for the selected server (for all its backups) or for a single, specific backup.
Inline Chart Controls
Quick access controls are available directly on chart panel headers for easy configuration without navigating to Display Settings:
Time Range Selector
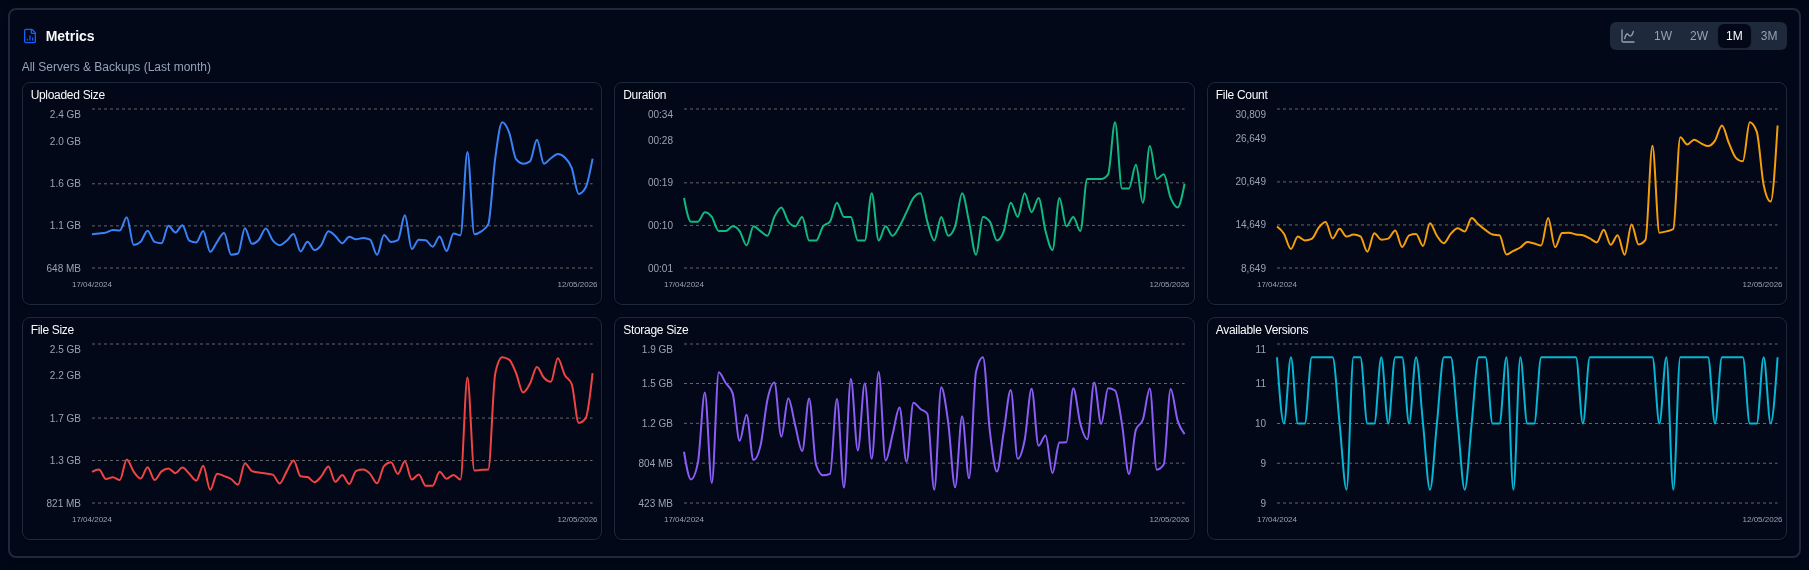
Pill buttons appear in the chart header for quick time range selection: 1W | 2W | 1M | 3M
- 1W: Last 7 days (rolling window)
- 2W: Last 14 days (rolling window)
- 1M: Last 30 days (rolling window, default)
- 3M: Last 90 days (rolling window)
Changes made here sync with your Display Settings, so your preference is remembered across page refreshes.
Chart Style Toggle
A toggle button in the chart header allows you to switch between:
- Smooth Lines: Display data points connected with smooth curves
- Bar Chart: Display data as discrete bars for each time period
Both modes use time-bucket aggregation for optimal display. Empty periods in bar mode render no bar. Your preference persists across page refreshes and is synced with Display Settings.
Chart Data Consolidation
When multiple backups occur on the same day, duplistatus consolidates the data before displaying it on charts:
- SUM: Used for cumulative metrics (Duration, File Count, File Size, Uploaded Size)
- LAST: Used for Storage Size (the most recent value of the day)
- MAX: Used for Available Versions (the highest count of the day)
This consolidation happens before time bucketing is applied, ensuring accurate aggregated metrics. For example, two backups on 5/12/26 will produce one consolidated data point on the chart.
Metric Definitions
- Uploaded Size: Total amount of data uploaded/transmitted during backups from Duplicati server to the destination (local storage, FTP, cloud provider, ...) per day.
- Duration: The total duration of all backups received per day in HH:MM.
- File Count: The sum of the file count counter received for all backups per day.
- File Size: The sum of the file size reported by Duplicati server for all backups received per day.
- Storage Size: The sum of the storage size used on the backup destination reported by the Duplicati server per day.
- Available Versions: The sum of all available versions for all backups per day.
You can use the Display Settings control to configure the time range for the chart.